Aboutstatistics → data science
I'm a statistician working as a junior data scientist at Muğla Sıtkı Koçman University since March 2026, where I lead the university's enterprise data platform project. I finished my BSc in Statistics second in the department (GPA 3.47/4.00) and I'm doing a thesis MSc alongside the job.
What I care about is evaluation: group-aware splits, metrics that match the goal, a side-effect metric next to every accuracy metric, and writing down the ideas that didn't work. Python, SQL and R; first author of a published book on ML-based data preprocessing.
Off the clock I play drums and electric guitar — that's my room up there. The octopus does both too: it drums, and now and then crawls over to the amp and takes the guitar. Every drummer wants more arms.
Featured projectopen source · Python · MIT
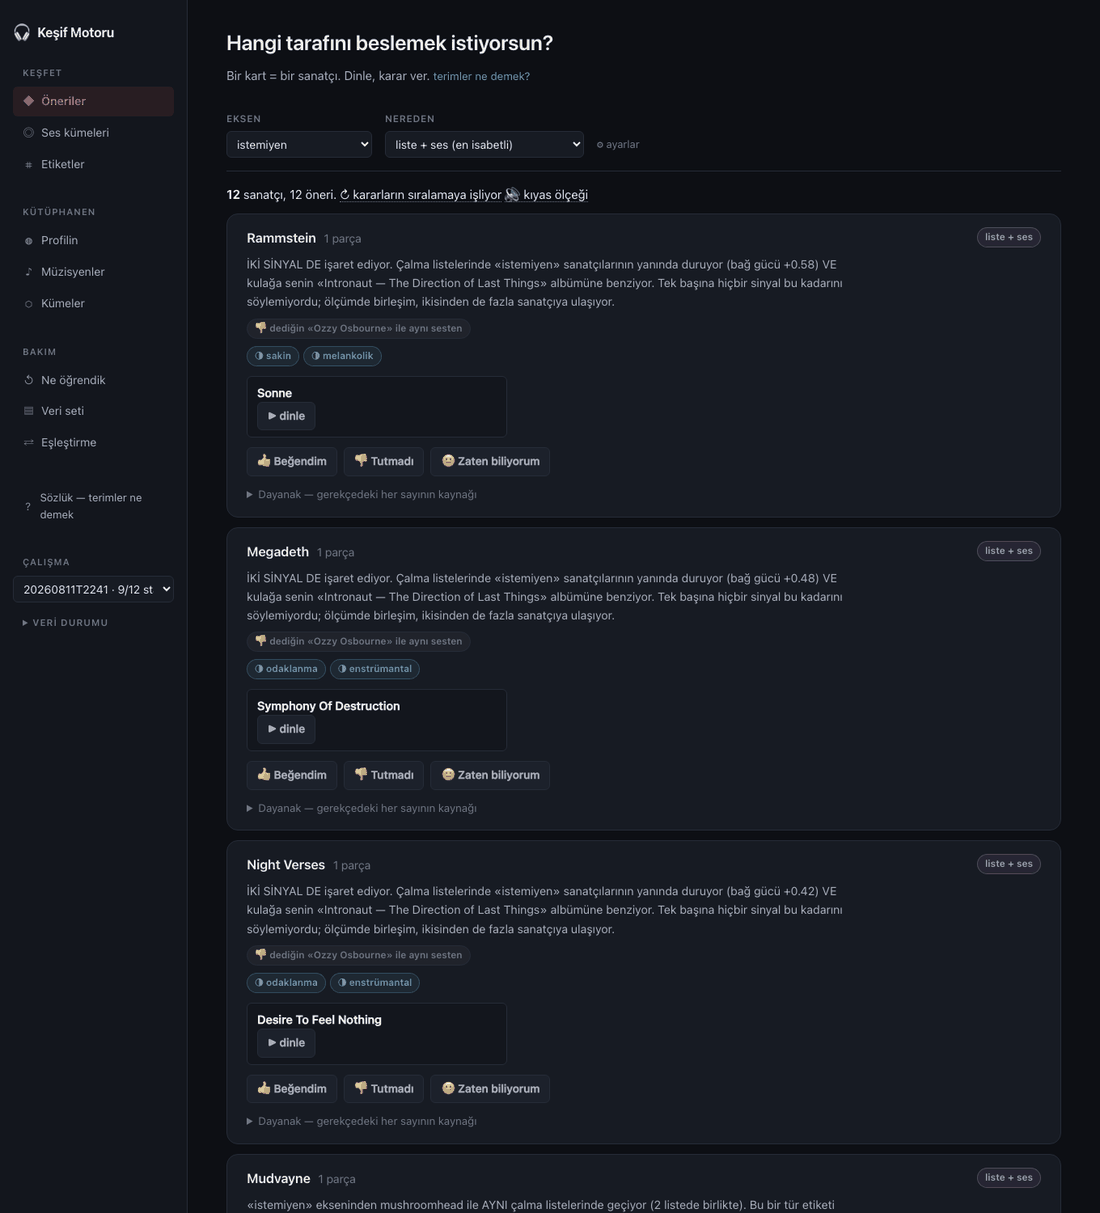
Music Discovery Engine
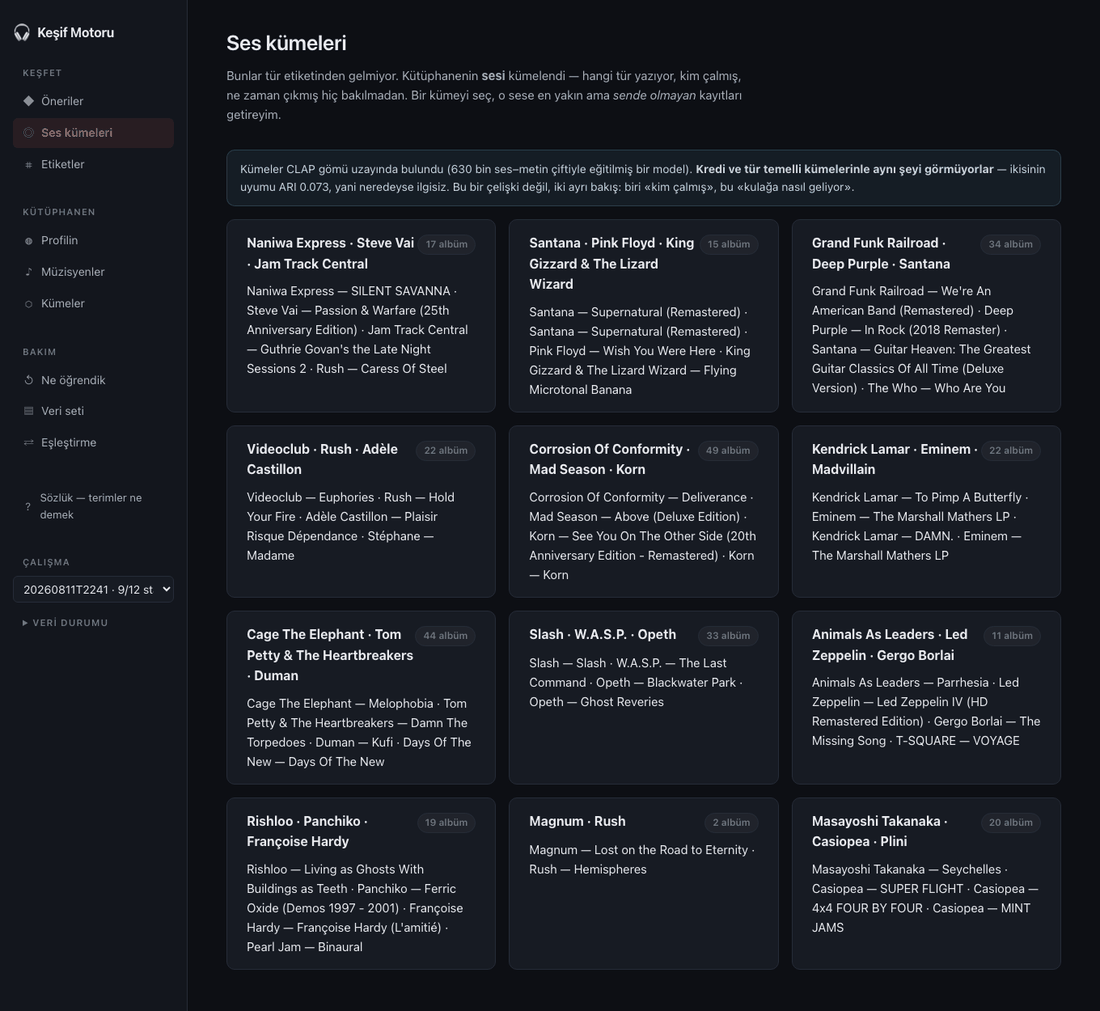
I listen to my own FLAC library on a portable player, so no streaming recommender ever sees what I play — and I stopped discovering new music. This engine reads the library, pulls who played on each record from MusicBrainz and Discogs, finds my taste axes with fuzzy clustering, and ranks artists I have never heard of. Every ranking change is scored before it ships.
- I rejected the setting with the best recall.A parameter sweep showed recall saturating while a popularity proxy kept climbing: the metric-optimal setting made recommendations more mainstream than my own library. That is the opposite of the goal, so I kept the metric-suboptimal one and now report a side-effect metric next to every accuracy metric.
- A model that looked fine and didn't transfer — documented, not shipped.A gradient-boosted genre classifier trained on 106,574 tracks × 518 features, split by artist to prevent leakage, scored 0.677 accuracy (0.521 macro-F1, 9 classes). On my own audio it collapsed. Comparing feature distributions found 25 columns at |z| > 3, traced to a 22.05 kHz caching decision plus domain shift.
- The largest gain wasn't a new model.A co-occurrence score saturated after two playlists, so "together in 2 lists" and "together in 16" looked identical. Weighting it by the evidence behind it beat every feature I had added in the preceding weeks.
- Most of the hours went to entity resolution.Six measured fixes to the matching rules (reissue years, subtitles, stage names vs. band names, typographic dashes…), 106 artist aliases merged across Latin and Japanese scripts — and the last 24 albums left unmatched on purpose, because a wrong match is worse than none.
Analysesinteractive · open data
How low will Istanbul's reservoirs go — and can May tell us?
Ten reservoirs, October 2000 to February 2024, from the IBB open-data portal. “May level minus 40 points” predicts the autumn low with a mean error of 9.3 points over 18 out-of-sample years, against 16.4 for assuming an average year. Half the work was fixing the data.
Pictured: November 2007, the record low. The monitor in the room plays the same data, month by month.
Experience
Enterprise data platform — Muğla Sıtkı Koçman University
Mar 2026 – presentDesigned the three-stage architecture — data dictionary → SQL data model → automated reporting dashboard — and built the data dictionary covering every table and field in use across the university, with automated extraction where source systems exist and a controlled manual-entry flow where they don't.
Research intern — Düzce University, Office of Research
Jun – Jul 2024Turned a manual comparison of research-centre performance into an automated, repeatable report; analysis in R and SPSS.
More projectspinned on the board
LEANCLUST — student analytics dashboard
R/Shiny app that clusters students week by week from LMS data (DTW + Ward.D2) and produces instructor-facing reports. The accompanying paper is under review at the Journal of Learning Analytics (first author).
MSstatsQC — contributor
Bioconductor package for longitudinal quality control of mass-spectrometry proteomics. I integrated a new statistical method and the MSstatsQC-ML supervised learning approach.
Netflix Prize, revisited
Team project (2025) on the 100M-rating Netflix Prize data, re-analysed in 2026. The same matrix factorisation scores 0.919 RMSE on the official probe set (Netflix's Cinematch: 0.951) and 0.825 on the random split behind our earlier 0.81: the split, not the model, made the difference. Includes a similar-films explorer. Code
Football scouting app
Similar-player search, score visualisation and player-card generation over statistics for 7,819 European footballers, built with Dr. Serhat Emre Akhanlı.
What makes a 90-point Bordeaux?
14,349 Wine Spectator reviews as 985 binary descriptors: logistic regression reaches 87.3% accuracy (AUC 0.938) under leakage-checked validation, and praise words out-predict flavour words. The app pairs every wine with cheeses, Turkish equivalents and the nearest shop. Code
Missing-data imputation benchmark — TÜBİTAK 2209-A
Funded research comparing imputation algorithms on large datasets in R, supervised by Prof. Dr. Özlem Gürünlü Alma; presented at an online conference.
Does Scotch taste follow geography?
A flavour atlas of 86 distilleries: the link between distance and taste (Mantel ρ 0.20) disappears without Islay (ρ 0.07), and location predicts only smoke and iodine. The app finds the closest taste you can buy in Türkiye, a cheese to pair and shops nearby. Code
A Computational Wine Wheel for whisky
The wine papers' method (Chen et al.) carried over to Scotch on Lee et al.'s flavour wheel: 3,580 phrases → 270 attributes over 2,247 Whisky Advocate reviews, with 94.7% recall and 94.5% precision on 40 reviews read only after the dictionary was frozen. The attributes barely predict a 90+ score (77.8% vs 74.6% baseline) and agree with a tasting panel only on iodine, smoke and fruit. The finder ranks whisky and wine sold in Türkiye by taste, adds cheese and snacks with dated prices, builds a basket and marks the nearest shops. Code
Can this data answer "who shops online?"
An audit before modelling: every column of a Kaggle shopping dataset is an independent random draw (strongest of 231 correlations |ρ| = 0.025) and the label is a formula of 8 columns, so a 99.7%-accurate model recovers the generator, not the shopper. Code
Education & publications
MSc in Statistics (by thesis)
2026 – presentMuğla Sıtkı Koçman University · Thesis: brain tumour detection with image processing and AI
BSc in Statistics
2020 – 2025Muğla Sıtkı Koçman University · GPA 3.47 / 4.00 · ranked second in the department
Book. Şafak, S., Gürünlü Alma, Ö., & Özyurt, U. (2026). Makine Öğrenmesi Temelli Kayıp Değer, Aykırı Değer ve Boyut İndirgeme Yöntemleri — R Uygulamalarıyla [ML-based missing value, outlier and dimensionality-reduction methods, with R]. Nobel Akademik Yayıncılık. ISBN 978-625-386-811-6.
Journal article. Şafak, S., Adnan, M., Doğu, E., & Akhanlı, S. E. LEANCLUST: Improving Instructional Decision-Making via Longitudinal Analytics and Dynamic Student Profiling. Journal of Learning Analytics — under review.
Talk. Oral presentation, 4th International Conference on Innovative Academic Studies.
Contactthe sign in the window says open
Open to data scientist and data analyst roles, in Türkiye or remote. The fastest way to reach me is email.